In the last few years, I have attended several Qlik-organized meetings like Qonnections and –believe me– those guys really know how to host an event! Usually, there are great presentations, delicious food and interesting announcements. However, I’ve always felt that they are more focused on the customers, partners and sales people.
In contrast, independent events like the Qlik Dev Group and the Masters Summit have something special: they’re created specifically for the developers which, in my opinion, are the real heroes behind all the Qlik implementations.

Let me start with the Big Four: Rob Wunderlich, Barry Harmsen, Oleg Troyansky and Bill Lay. The Masters Summit for Qlik is an event launched in 2013 that can definitely take your Qlik skills to the next level. With dynamic presentations and lots of ready-to-use resources, this forum will surprise even the most experienced developers with tricks that will change the way you approach your applications. I had the chance to travel to Copenhagen for last year’s summit and it was absolutely worth it!
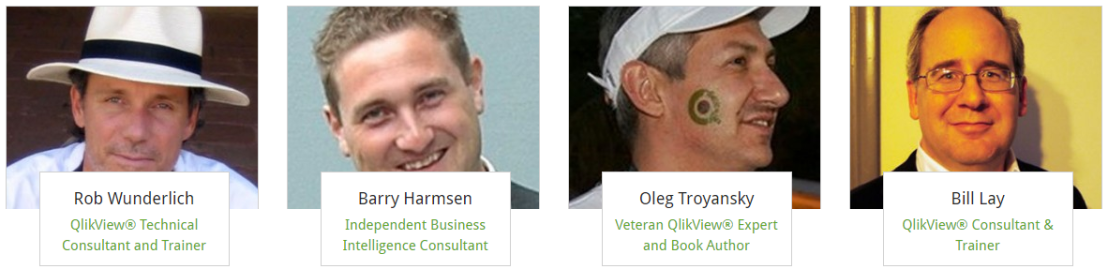
I won’t lie to you, I was a little disappointed when I saw that Rob doesn’t wear his hat all the time and that Oleg got rid of his Qlik tattoo… but after the shock, I really enjoyed their presentations. Their next events will take place in Johannesburg and Texas in September / October, so you’re right on time to book your flights.

This dynamic group of Qlik developers is rapidly taking over the world by showing everyone that “Eat. Sleep. Qlik. Repeat.” is the best way to live. Since its inaugural event in London (2014), it has displayed an amazing growth. Today, it holds events all around the world in cities like San Francisco, Amsterdam, Rio de Janeiro, Hamburg, Santiago, Paris and Mexico (it’s pretty much like any Pitbull’s song).

Qlik Dev Group events are sessions (usually evenings after work) dedicated to engage with the architects, developers, technical BAs and PMs actually involved in onsite implementations. The regional leaders are renowned experts like Shilpan Patel, Torben Seebach, Brian Booden and Ralf Becher (just to name a few) and even though these meetings are independent from Qlik, it’s not strange to see Donald Farmer, Henric Cronström and other Qlik guys taking the stage.
I strongly recommend you to check if there’s a group in your city. If not, why don’t you start it? Being a Regional Leader, a Community Presenter or just attending the events is a lot of fun. You get to know colleagues from multiple industries and share tips, experiences and success (or failure) stories. Besides, you have pizza and beer so, what else could you ask for?
A couple of weeks ago, I met with Karl Pover and Miguel García, the authors of Learning QlikView Data Visualization and QlikView 11 for Developers respectively, in order to talk about organizing this event here in Mexico. At first, we thought it was going to be very difficult, but Jason Michaelides, Matt Crowther and Richard Pearce have created an amazing structure that keeps everything under control and helped us at every step of the way (thanks guys).

Our first event took place last week in a hotel near downtown with an attendance of 74 Qlik-enthusiasts (not bad for our first try, right?). We mixed short breaks full of delightful snacks and a couple of beers with four formal presentations:
- Advanced Customer Segmentation by Karl Pover
- Managing Multiple Calendars (and a bit of advanced Set Analysis) by Miguel García
- Data Visualization Best Practices by Julián Villafuerte
- What’s new in the Qlik world by José Ángel del Río (Expert Solution Architect @ Qlik)

I certainly enjoyed the technical sessions but, to be honest, my favorite part was the atmosphere during the breaks. Seeing consultants, independent developers, master resellers and project managers talking, sharing experiences and laughing about geeky jokes was really amazing.

By the way, in order to celebrate the first edition of the Qlik Dev Group in Mexico, our friends at Packt Publishing are offering discounts on all their QlikView titles until the end of May. My personal recommendations are QlikView 11 for Developers, QlikView Unlocked, Creating Stunning Dashboards with QlikView (obviously) and the Redmond collection, but you can check the complete catalogue here.
50% off on e-books: 5VJJ7pFEB
30% off on print books: P2iHDKBP
Also, Karl Pover (a.k.a Honey Boo Boo) is about to publish a new book called Mastering QlikView Data Visualization which tackles Qlik apps from an enterprise perspective. It’s quite interesting, but let me warn you: this is not a book designed for newbies. However, if you have experience with Set Analysis, aggr() and variables, it’s certainly a title that you’ll enjoy. Be sure to check it out!
But anyways, don’t hesitate to participate in this kind of events or even better, become a Regional Leader or a Community Presenter. I assure you won’t regret it! Also, if you’re going to Qonnections in a couple of days, don’t forget to visit our stand in the Developer Network Lounge (we’ll have cool stuff).
Until next time!

Looks like you had a great night! See you next week.
Oh my dear and beloved iluminatis, can you tell me when all bugs are going to be fixed in only one version?
All of sudden trellis doesn’t work at all. Version 12.
That is the problem, compicate, qlik – plagio tableau – sense and mashups and hundreds of bull…. but, is it everything working?…..
besides of count and sum, I mean.
I’ve had some issues with QV12 as well, especially with aggr() behaving differently… I ended up downgrading to QV11 and everything turned right. I hope they fix those bugs soon!
Nice post. Thank you Julian. What is the issue with Aggr() function in QV12?
Hey DV! How is it going? Family has kept you busy lately, eh? 😛
It was a strange behavior… I had QV11 installed in my machine and a formula that included an aggr() with 3 fields was working alright until I upgraded to QV12. Same app, same formula, different results. After that, I downgraded to version 11 and it went back to the correct figure.
I checked the bug with Qlik Support and they were able to replicate it, so they started working on the solution. To be honest, I haven’t checked if it’s already fixed. I thought it had to do with the new QIX, but we tested the formula in Sense and it worked perfectly!
Gracias por la info, me sirve mucho! podrías recomendarme algún libro para empezar con QlikView?
Saludos!
Si vas empezando con QlikView creo que los dos mejores títulos son QlikView 11 for Developers de Barry Harmsen y Miguel García (https://www.packtpub.com/big-data-and-business-intelligence/qlikview-11-para-desarrolladores-espanol) o QlikView your Business de Oleg Troyansky (https://www.amazon.com/QlikView-Your-Business-Expert-Discovery/dp/1118949552). De hecho, hay un descuento especial en el primero de ellos hasta finales de agosto usando el código AJMBIKF50!