Category: Info

Geo… what?

One of the most significant changes Qlik has experienced so far is the substantial growth of their product family. What once was a one-man show, is now a robust portfolio that addresses several business needs. Do you want pixel-perfect reports? Here’s NPrinting. You don’t like in-house deployments? Meet Qlik Sense Cloud. Do you need more data? Welcome to Qlik DataMarket. All these new modules help us work more efficiently, enrich our analyses, and ultimately, make better decisions.

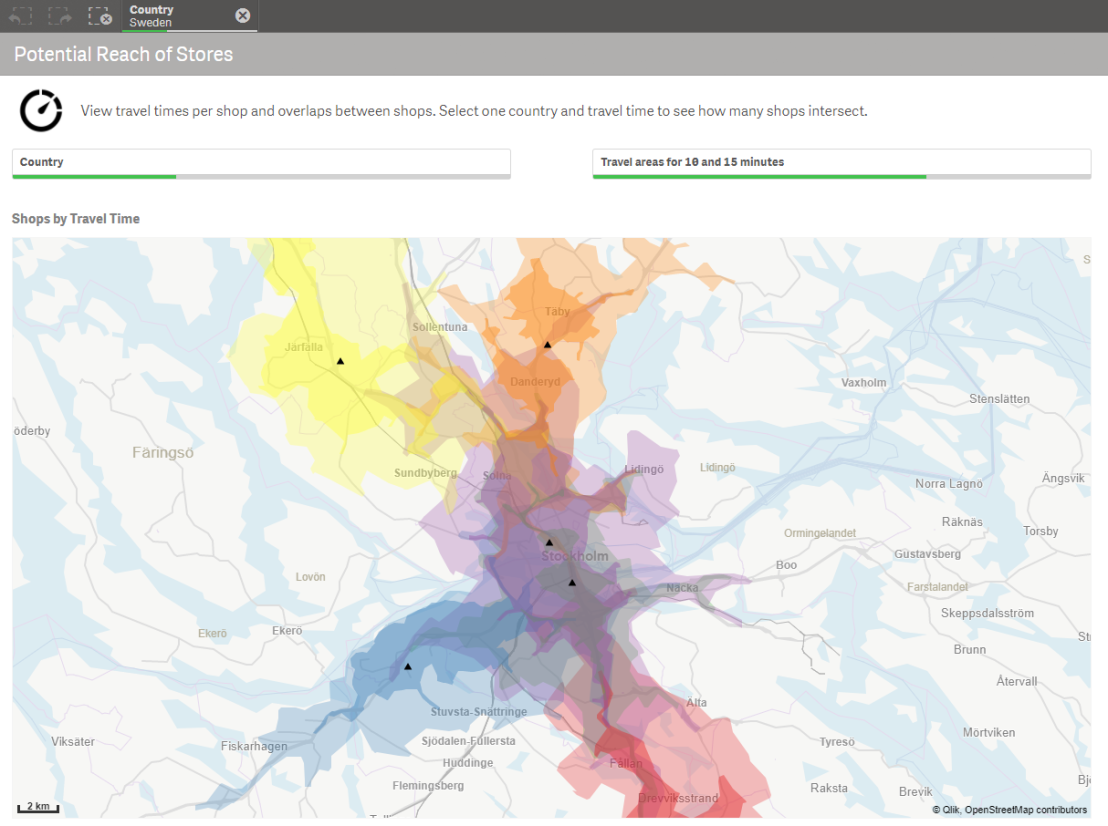
One of the most interesting newcomers in this list is Qlik GeoAnalytics (formerly known as Idevio). Even though it isn’t exactly new, I think there are still some misconceptions around this product. Yes, it is a tool that allows you to create cool maps in Qlik, but there’s much more to it. In this post, I’ll show you some of my favorite features and how they can help you analyze geographic data. This might not be a comprehensive list, but hopefully it will give you an idea of the real potential behind GeoAnalytics.
34_01 Continue reading “Geo… what?”

QlikAdvice: Give context to your data

Hello everyone and welcome to QlikFreak. This will be our first post in a new category called QlikAdvice, where we’ll talk about dashboard design in a broader sense. Instead of focusing on technical stuff (we already cover that in our Just Qlik It posts), this section will contain functional tips that will help you present information in an efficient and elegant manner. These principles will be applied to Qlik apps (QlikView and Qlik Sense), but you’ll find out that most of them are useful in other domains as well, from web design to NPrinting Reports, or even PowerPoint presentations (or should I say Qlik Sense Stories?). Today’s topic is an old classic you should never forget: context.

QlikAdvice: Give context to the data to improve the decision-making process

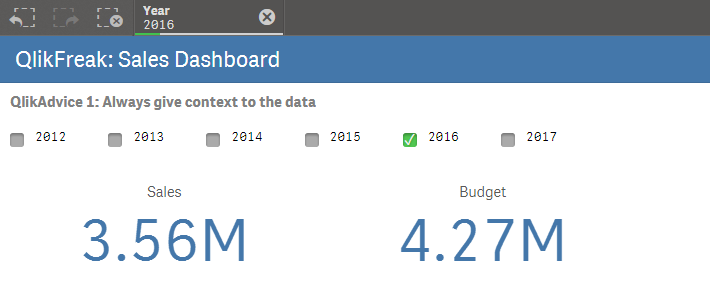
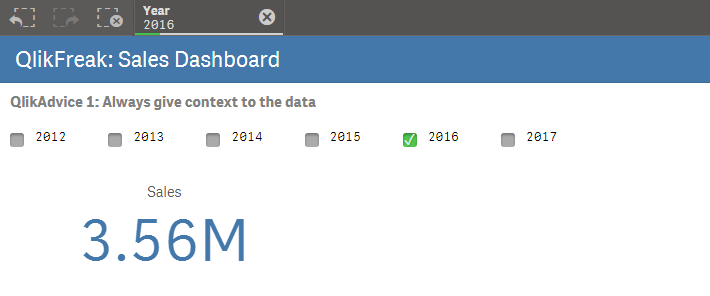
When it comes to analyzing data, context is everything. If you present isolated figures, users will have a hard time trying to find out the real story behind them. As a Qlik developer, it’s easy to fall in the trap and start shooting random KPIs right away. For example, I could start my sales dashboard with something like this:

31_01

OK, we sold 3.56 M in 2016, that’s cool. However, what does this tell me? Was it a good or a bad year for our sales reps? Well, it all comes down to a simple question: “compared to what?”. In order to evaluate their performance, it would be better to have some kind of reference. For instance, the budget:

31_02 Continue reading “QlikAdvice: Give context to your data”

Qlik-Trivia

Hello everyone and welcome to QlikFreak. Since this is our last entry of the year and many of you are enjoying your holidays away from the office, I thought it would be cool to try something a little different. Today, instead of having a tutorial or a fun Qlik app, I created a Qlik trivia with interesting scripting scenarios that will make you think twice before writing down your answers!

I know you don’t want me to spoil all the surprises, so we’ll check the answers at the end of the post. So anyways, without further ado, let the games begin! OK, no, wait, before you go, there’s one more thing… I think you’ll get the same results regardless of the version you’re using, but just in case, I’m working with QlikView 12 SR4 and Qlik Sense 3.1 SR4 😛

30_00

Question 1:

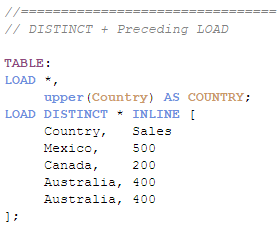
If you’re an experienced Qlik Developer, chances are that you’ve used DISTINCT in more than one of your scripts, right? Well then, tell me how many records will this table have:

30_01

a) 4 records          b) 3 records          c) 0 records          d) OMG, he’s using Qlik Sense

Tip: The last two records are exactly the same. Continue reading “Qlik-Trivia”

Qlik Dev Group & Masters Summit for Qlik

In the last few years, I have attended several Qlik-organized meetings like Qonnections and –believe me– those guys really know how to host an event! Usually, there are great presentations, delicious food and interesting announcements. However, I’ve always felt that they are more focused on the customers, partners and sales people.

In contrast, independent events like the Qlik Dev Group and the Masters Summit have something special: they’re created specifically for the developers which, in my opinion, are the real heroes behind all the Qlik implementations.

Masters Summit for Qlik  24_02

Let me start with the Big Four: Rob Wunderlich, Barry Harmsen, Oleg Troyansky and Bill Lay. The Masters Summit for Qlik is an event launched in 2013 that can definitely take your Qlik skills to the next level. With dynamic presentations and lots of ready-to-use resources, this forum will surprise even the most experienced developers with tricks that will change the way you approach your applications. I had the chance to travel to Copenhagen for last year’s summit and it was absolutely worth it!

24_01

I won’t lie to you, I was a little disappointed when I saw that Rob doesn’t wear his hat all the time and that Oleg got rid of his Qlik tattoo… but after the shock, I really enjoyed their presentations. Their next events will take place in Johannesburg and Texas in September / October, so you’re right on time to book your flights.

Qlik Dev Group 24_03

This dynamic group of Qlik developers is rapidly taking over the world by showing everyone that “Eat. Sleep. Qlik. Repeat.” is the best way to live. Since its inaugural event in London (2014), it has displayed an amazing growth. Today, it holds events all around the world in cities like San Francisco, Amsterdam, Rio de Janeiro, Hamburg, Santiago, Paris and Mexico (it’s pretty much like any Pitbull’s song). Continue reading “Qlik Dev Group & Masters Summit for Qlik”

QlikView Consultant Starter Pack

Unfortunately, a couple of days ago, one of my colleagues invited me to one of those “Why am I even here?” meetings with a new customer. I’m sure you are all familiar with them: long reunions with no objective whatsoever where all the participants strive to look busy and productive, but in reality, they’re not accomplishing anything at all.

In the middle of this rampage (and questioning my very existence out of the boredom), I remembered some “Started Pack” memes I saw earlier that day:

21_01

But then, I started thinking, I’ve never seen a QlikView Consultant Starter Pack. Of course there are several training kits and video collections for beginners, but let’s say you meet someone who has just finished his basic QlikView training. How would you help him equip himself with all the tools and resources that he’ll need for his journey as a new consultant? Well, after some thought I came up with this list (and yes, I managed to do something relevant during that meeting too):

Decent computer

OK, don’t give me that look… Yes, I can see you rolling your eyes already! Wait a minute, this is just a little reminder for the newbies.

21_02

Don’t forget that QlikView models are loaded into RAM. So, if you’re going to work with several millions of records, you’d better get a good laptop (and yes, you’re going to need Windows). Though you can now develop in any browser or mobile device using Sense, let’s be honest: it is much more comfortable to work in your own machine, with all your apps, images and other resources available.

Continue reading “QlikView Consultant Starter Pack”

Creating Stunning Dashboards with QlikView

It’s been a while since the last time I shared a post here, but believe me, I have a great excuse! Over the last few weeks, I’ve been working very hard with the guys from Packt Publishing on a book that covers two of my favorite topics: dashboards and data visualization. So, without further ado, I gladly present you “Creating Stunning Dashboards with QlikView”.

Cover

This tome guides you through the process of creating effective and engaging dashboards that deliver tangible value to the business. Throughout its chapters, you will learn how to apply some of the best practices in the field of data visualization, create a robust navigation schema, work with colors, choose the best chart types for each scenario and many other things that will help you create useful applications that will uncover all the stories behind your data.

Though you might think that this is the average “do this, do that” handbook, this publication was written much like my blog; it contains technical stuff, best practices, opinions, tutorials and even some humor. However, this time I had an amazing group of people that helped me out: Larissa Pinto, Priyanka Mehta, Shruti Iyer and Parag Topre from Packt; Hakan Hansson, Speros Kokenes, Mark O’Donovan and Karl Pover in charge of the technical review and QlikView All-Star Bill Lay who was kind enough to write the foreword.

PACKT LogoAmazon LogoBarnes Noble Logo


If you want to know more about this book, go to its section in this site (you didn’t know there were other pages in this blog right? Surprise!!!). Although Amazon usually delivers faster, I prefer Packt because you have immediate access to the digital version in multiple formats*

Subpages

I really like the end result, and I hope you find it useful and have a good time reading it, so be sure to check it out. Also, don’t forget to share your thoughts about it, I’ll be looking forward to hearing your feedback!

Hope to see you around,

Julian Villafuerte