Tag: visualization

VIWICUMO: Slope Charts

Hello everyone and welcome to QlikFreak, the most reliable blog in the web, with consistent updates and definitely no multi-year hiatus where the author experienced an existential crisis. My name is Julian Villafuerte and yes, I’m still alive. Recently, I decided it’s time to get back to the things I love the most: broidery, newspaper crosswords and birdwatching. But, since it’s getting a little cold outside and I haven’t bought a newspaper in 25 years, I guess I’ll have to resume my blogger career as well.


VIWICUMO (no, that’s not a typo)

If you’ve been working with data visualization for a while, you’ll know that there are some charts you can never get rid of. Regardless of the industry, audience, or business process you’re analyzing, 99% of the dashboards you deploy will feature tables, bar charts, and line charts. And rightfully so. Those visualizations are super useful, flexible, and easy to use. Most data experts will try to deny it, but even pie charts have a special place in our hearts.

However, there are other visualizations that are equally amazing but tend to run away from the spotlight. Let’s be honest, you’ll never see a violin plot or a scatterplot matrix in the sales report that Karen from accounting has been sending every Thursday since 1985. Maybe it has to do with the purpose they serve, their complexity or the lack of data related skills in our companies, but sadly, these stars don’t shine as bright as the others. For this reason, I decided to create a new series called VIWICUMO: Visualizations I wish I could use more often (patent pending, LOL). To get things started, we’ll discuss the poor man’s line chart, the king of the Δy / Δx, none other than the slope chart.

Continue reading “VIWICUMO: Slope Charts”
When Qlik Sense meets FIFA World Cup

Hello everyone and welcome to QlikFreak! In the last few weeks, we’ve seen a lot of interesting things happening in the Qlik ecosystem. Personally, I’ve been playing a lot with the latest Qlik Sense release (yeah, the one with “the beast”) and I must admit it’s really cool. I specially liked the fact that you can change the grid size whenever you like and the new “Publish” option in the hub (sometimes, those small details make your life much better!). There are a couple of new courses available in the QCC, the data literacy initiatives are getting better and Qlik acquired Podium Data, which certainly will bring a new perspective to the company.

In addition to these events, I’m sure you’ve been extremely busy with other critical issues like scheduling fake meetings so you can watch the world cup in the meeting room with the huge screen. (Yes, I know you had a PowerPoint presentation in your screen, but you were watching all the games in your tablet, Maurice. You should be ashamed!)

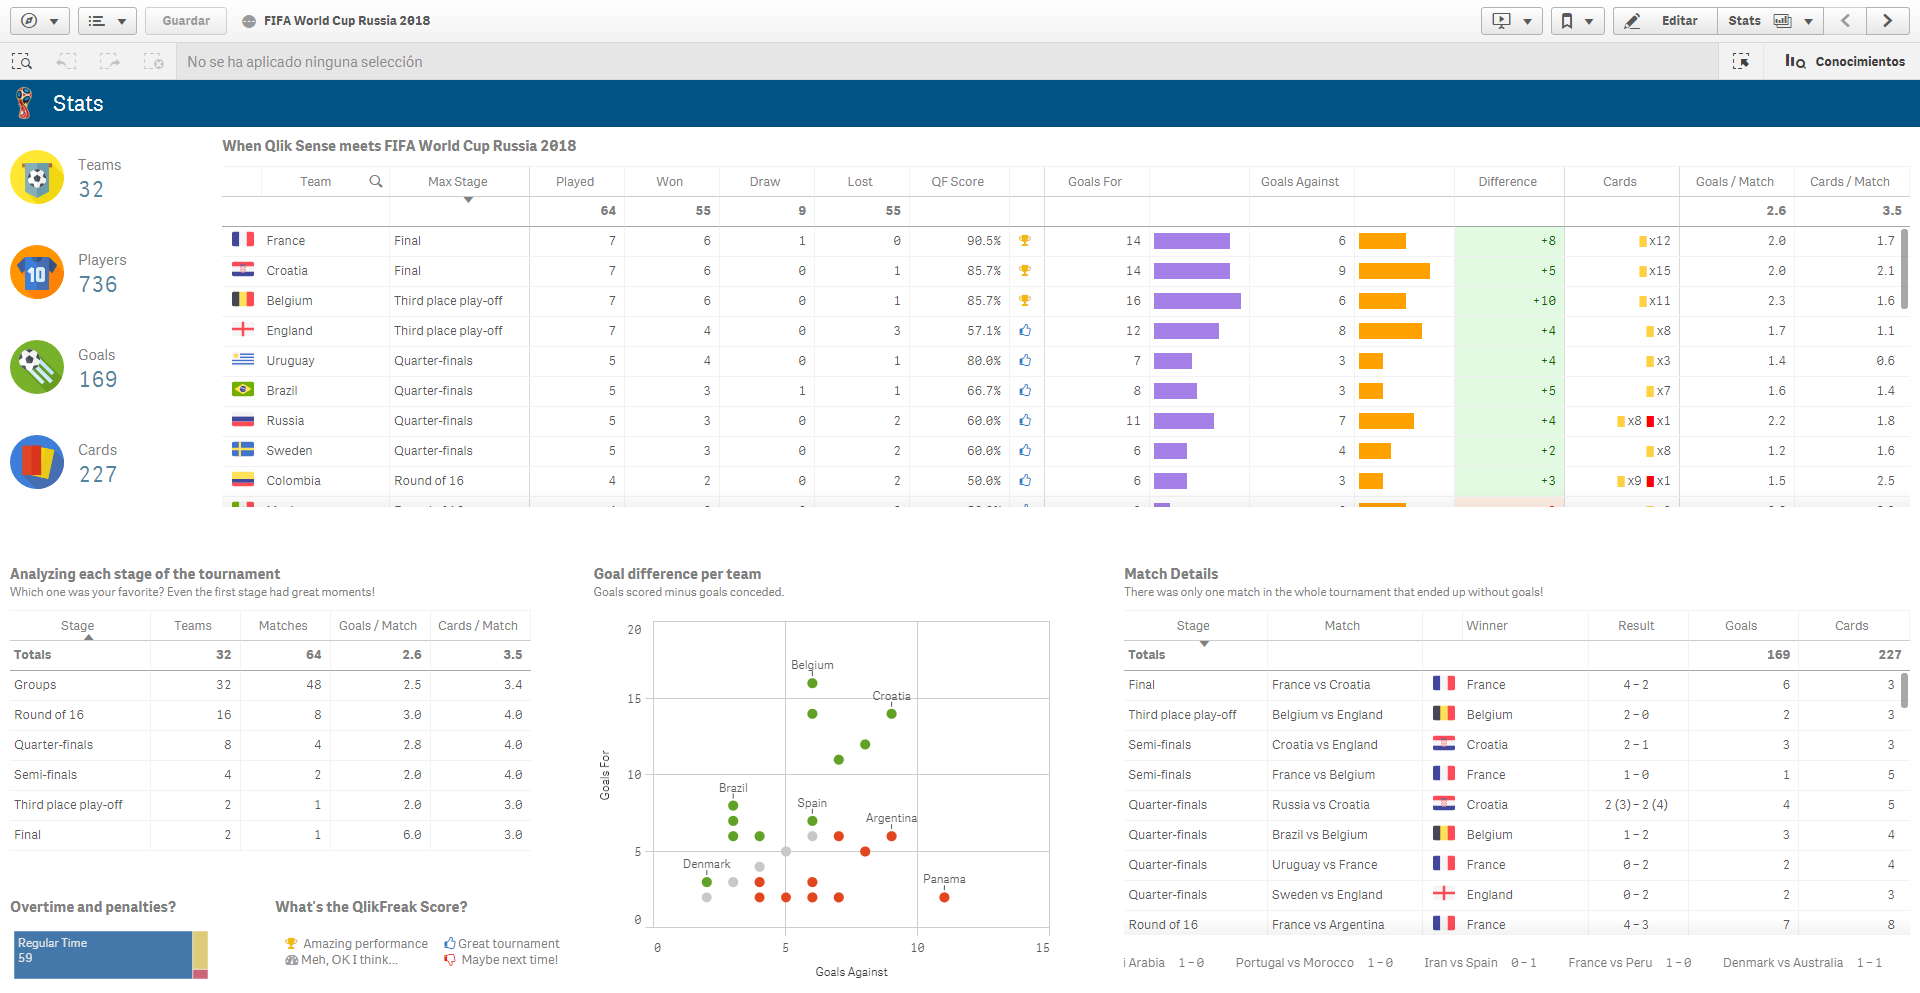
Honestly, this was one of the best world cups I’ve seen (especially if you compare it to the last one!). We had great games, some unexpected results, a couple of heartwarming moments and of course, dozens of high quality memes. Actually, now that the dust has settled a little bit and everyone is getting back to their standard routine, why don’t you take some time to relax and analyze what happened during the tournament with a Qlik app? Get ready, because today Qlik Sense will meet the FIFA World Cup Russia 2018!

37_01

Continue reading “When Qlik Sense meets FIFA World Cup”

About Slopegraphs and Bumps Charts

Hey everyone! Today’s post answers a request from one of our readers and features two not-so-common visualizations that you can use to make time comparisons: slopegraphs and bumps charts. Although these objects have a very simple nature, they’re also quite elegant and intuitive, so there’s a good chance that they will help you get some unexpected insights in your analyses.

We’ll also discuss one or two tips that can help you improve their readability and make them more meaningful by adding extra context to the data. As requested, the football dataset that we’ve been using lately will give life to our examples! 😉

Slopegraph

Slopegraphs are a great way to compare two points in time. However, instead of describing the ups and downs along the way like traditional line charts, they focus on how the journey started and how it ended. This visualization is the perfect candidate for “then and now” analyses (much like that TV show that presents celebrities and how they looked 30 years ago). * Note to self: stop making that kind of references, people will laugh at you. You should recommend Cole’s blog instead. *

When working with these charts, our brain can easily spot patterns and recognize the distinctive slopes of certain elements in terms of direction or magnitude. It is also an intuitive way of showing how the rankings changed from a point in time to another, as the lines will intersect each other and end up in a different order.

26_01

In this example, we can visualize the performance of all the teams in the Premier League over the last two seasons. Each squad is portrayed by a line and its position and slope depend on the rank achieved in both the 2015 and 2016 tournaments. In order to improve the chart’s readability, you can highlight the selected team by adding some color and changing its line’s width.

26_02

* Fun Fact: This chart is so cool that it made it to the cover of one of my favorite books about data visualization, The Functional Art by Alberto Cairo. Continue reading “About Slopegraphs and Bumps Charts”

Tile Grid Maps

Have you ever had one of those “of course I can do that in QlikView” moments? As a Qlik developer it’s not uncommon to find yourself struggling to create a chart or pull off a complex script that nobody asked for, but for some strange reason, you decided to tas a personal challenge. Well, I just had one of those moments.

25_28

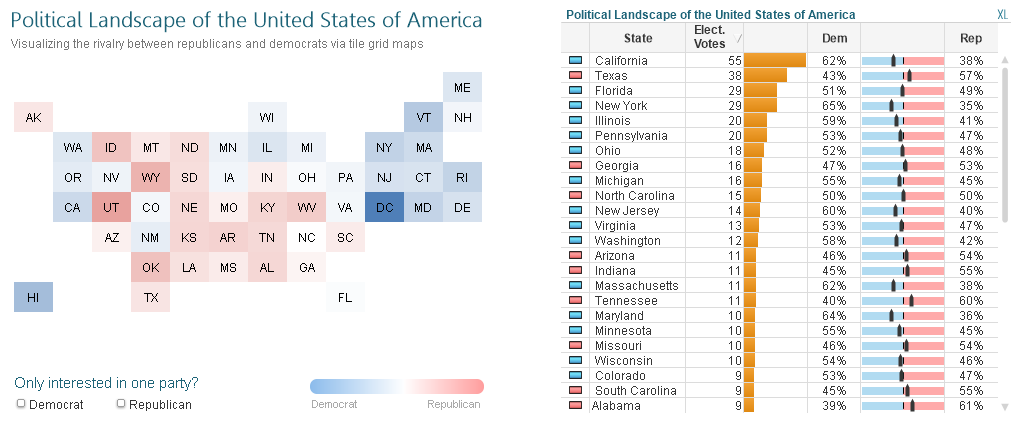
I couple of days ago I was wandering around my usual blogs when I found a post by Alberto Cairo  where he talked about an interactive visualization created by the FiveThirtyEight team regarding the political preferences in the United States. [By the way, if you don’t follow those blogs you are missing a lot of great stuff!]

25_29

Besides being a stunning way to present What-If scenarios, I liked the usage of the Tile Grid Maps, which have become a pretty popular visualization lately. What is a Tile Grid Map, you ask? Well, think of it as a mix between a choropleth map and a table heat map. If you want to see more examples, you can visit Bloomberg, The Washington Post or The New York Times.25_30

It is true that most of the times we strive for more accurate charts but ironically, this technique’s boon is that it disregards the actual size of the regions and translates them to equal-sized shapes (in this case, squares) so it becomes easier to see even the smallest areas. Therefore, this solution is excellent when the geographic size is not the most important thing, but maintaining a loose spatial distribution is.

So anyways… In today’s tutorial we’ll build something like this:

25_27 Continue reading “Tile Grid Maps”

Creating Stunning Dashboards with QlikView

It’s been a while since the last time I shared a post here, but believe me, I have a great excuse! Over the last few weeks, I’ve been working very hard with the guys from Packt Publishing on a book that covers two of my favorite topics: dashboards and data visualization. So, without further ado, I gladly present you “Creating Stunning Dashboards with QlikView”.

Cover

This tome guides you through the process of creating effective and engaging dashboards that deliver tangible value to the business. Throughout its chapters, you will learn how to apply some of the best practices in the field of data visualization, create a robust navigation schema, work with colors, choose the best chart types for each scenario and many other things that will help you create useful applications that will uncover all the stories behind your data.

Though you might think that this is the average “do this, do that” handbook, this publication was written much like my blog; it contains technical stuff, best practices, opinions, tutorials and even some humor. However, this time I had an amazing group of people that helped me out: Larissa Pinto, Priyanka Mehta, Shruti Iyer and Parag Topre from Packt; Hakan Hansson, Speros Kokenes, Mark O’Donovan and Karl Pover in charge of the technical review and QlikView All-Star Bill Lay who was kind enough to write the foreword.

PACKT LogoAmazon LogoBarnes Noble Logo


If you want to know more about this book, go to its section in this site (you didn’t know there were other pages in this blog right? Surprise!!!). Although Amazon usually delivers faster, I prefer Packt because you have immediate access to the digital version in multiple formats*

Subpages

I really like the end result, and I hope you find it useful and have a good time reading it, so be sure to check it out. Also, don’t forget to share your thoughts about it, I’ll be looking forward to hearing your feedback!

Hope to see you around,

Julian Villafuerte

It’s not a bar chart!

Every professional is as good as his toolset and as a QlikView developer, there’s always room for one more trick under your sleeve. Today I will show you one of the most powerful –yet underused– chart for analyzing data: the histogram. Even though it is easy to create it I haven’t seen a lot of developers take advantage of it.

The important lesson here is that histograms are not exactly bar charts. The main difference is that bar charts are used to compare categorical variables whilst histograms represent distributions. Sounds interesting? No? Well, here’s an example.

A couple of days ago I was looking for a data set to try some functions and I got my hands on the ENEM results for 2011. The ENEM is a national exam taken by brazilian high school graduates that evaluates each institution (private and public) in subjects like mathematics, language and natural sciences.

With a traditional bar chart, you can address some questions like: Are there more public or private schools? Which state has the most schools? Which schools are the best ranked in mathematics?

15.1

But as your inner data analyst grows more interested, you will start asking more complex questions. When we create a bar chart for the top 10 schools in mathematics, we may realize that there’s a big discrepancy between the best and the worst elements:

15.2

Are there some extremely good schools raising the national average? Or alarming bad institutions brining it down? Are they all consistent? Can we separate them in groups (good, normal, bad)? Where’s the majority of the schools? Is there a significant difference between public and private institutions? Or between states?

Let’s see what QlikView can do for us. First, we’re going to change our classic conception of a bar chart by using the X-axis as the grade and the Y-axis as number of schools that got it. As you can see, the data adopts a shape that gives us a better perspective of the situation:

15.3

Far in the right, we’ve got great schools (there are not a lot of them, but their scores are pretty high). On the other end, those who might need a little help (grades below 420 points) and in the middle, the majority of the schools. We can appreciate that the curve is skewed to the left, with most of the schools scoring from 440 to 560. Remember, a higher bar represents a bigger number of schools. For example, the red bar (the highest of all the histogram) is conformed by 296 schools that got grades between 500 and 505 points.

Is there a difference between public and private high schools? Well, if we separate our histogram using a second dimension we’ll get something like this:

15.4

Some thoughts that will probably cross your mind are:

Continue reading “It’s not a bar chart!”