Category: Funny

Double Qlik?

Time to write another philosophical post that will upset some people and will bore some others to death. Hell yeah. But don’t worry, we’ll also have fun stuff, so bear with me. Here’s my story: In the last few months, I’ve been working a lot more with Qlik Sense and, even though I’ve learned to love it, I still have some doubts about its adoption and the future of the Qlik platform in general.

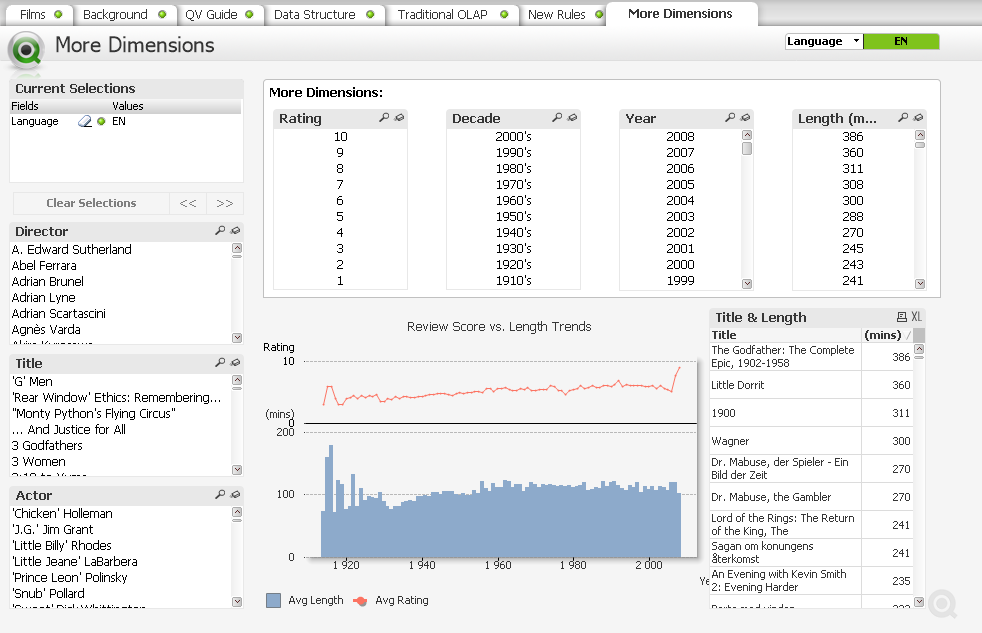
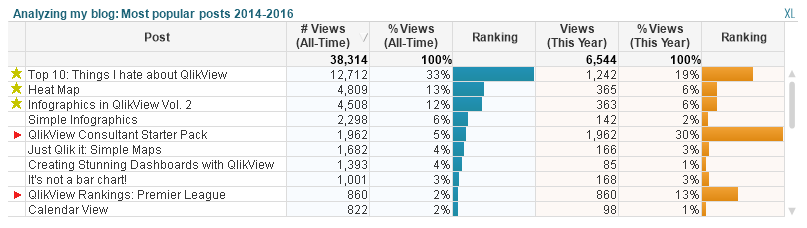
A few days ago, I saw a post by Qlik Luminary Aaron Couron where he asked the world a simple question: QlikView or Qlik Sense? What’s your preference? While I was reading the answers, I remembered many treads I’ve encountered in QlikCommunity and some good discussions we’ve had in our Qlik Dev Group events, but it specially reminded me of the comments I got after tweeting these images not so long ago:

32_01

32_02

Some people favored one over the other, some argued that both should coexist and some others simply went nuts. But regardless of which side you choose, it’s amazing to see the number and variety of opinions in this regard. In a way, I find it interesting how we’re still asking ourselves if this town is big enough for two Qliks. After all, Qlik Sense was released almost three years ago, which in technology standards is a lot of time!

Don’t forget to check Aaron’s full post here. Lots of cool stuff!

Like many of you, I’ve grown quite fond of Qlik Sense as well. It has many advantages like a flexible security schema, more competitive prices and amazing governability in terms of its users, data, apps, metrics and pretty much everything else. However, I don’t think I’m ready to get rid of QlikView just yet.

In the meantime, I also started questioning myself about how the users, developers and even our business model have changed recently. Even though I agree with Stephen Few regarding the soundness of Gartner’s Magic Quadrant (witness the mega-burn here), that’s definitely a message we should not ignore.  Continue reading “Double Qlik?”

Qlik-Trivia

Hello everyone and welcome to QlikFreak. Since this is our last entry of the year and many of you are enjoying your holidays away from the office, I thought it would be cool to try something a little different. Today, instead of having a tutorial or a fun Qlik app, I created a Qlik trivia with interesting scripting scenarios that will make you think twice before writing down your answers!

I know you don’t want me to spoil all the surprises, so we’ll check the answers at the end of the post. So anyways, without further ado, let the games begin! OK, no, wait, before you go, there’s one more thing… I think you’ll get the same results regardless of the version you’re using, but just in case, I’m working with QlikView 12 SR4 and Qlik Sense 3.1 SR4 😛

30_00

Question 1:

If you’re an experienced Qlik Developer, chances are that you’ve used DISTINCT in more than one of your scripts, right? Well then, tell me how many records will this table have:

30_01

a) 4 records          b) 3 records          c) 0 records          d) OMG, he’s using Qlik Sense

Tip: The last two records are exactly the same. Continue reading “Qlik-Trivia”

When QlikView meets the blockbusters

The associative model is definitely one of the best features in the Qlik platform. It is simple, elegant and intuitive but, at the same time, it is a very powerful tool that helps us unveil the stories behind our data.

When I attended my very first QlikView training, I remember Karl Pover used a generic demo called Movies Database to explain the navigation schema. Even though the app wasn’t exactly breathtaking, it was a great way to understand that every selection turns green, the associated elements remain white, and the unrelated items become gray.

28_01.png

From that day on, every time I had to explain the associative model, I relied on the always-available, rarely-updated but still-pretty-good, Movies Database demo that is installed with any version of QlikView. Up until now…

A couple of weeks ago, I was working with Daniela Lucero, one of the youngest consultants in our team, when I realized that my examples about The Matrix, Fight Club and Titanic were not making much sense to her because… well, she was 3 years old when those movies came out… So, we decided to take advantage of the Qlik REST Connector and refresh this old classic.

Daniela: Hello everyone, I’m Daniela and I’ll be using the orange font throughout this post! We took this opportunity to experiment with some atypical features in QlikView. To start with, we chose a dark background (which is usually a big gamble). We also decided to hide the tab row and use a custom-built menu instead, explore different wireframes, and use eye-catching visualizations such as infographics, image-based tables and even some extensions.

28_02.png

As usual, we’ll walk you through the most relevant features in the app (download here or here) while sharing technical recipes and useful tips regarding data visualization. We had a lot of fun creating this app, so we hope you like it! Continue reading “When QlikView meets the blockbusters”

When QlikView meets PokĂŠmon

Some people build QlikView dashboards to review the financial outcomes of their companies. Others use it to monitor their everyday operations in plants and warehouses. There are individuals who even create applications to analyze fun stuff like the Olympic Games or TV Series. In my opinion, QlikView should be exclusively used to answer humanity’s greatest inquiries and analyze relevant topics that affect our lives and our future; important things such as Pokémon 😛

When I was a kid, I used to play Pokémon games all the time. Blue, Yellow, Silver, Sapphire, Stadium, Snap, Pinball, Trading Card Game, you name it. And well, since everyone’s going a little crazy about Pokémon Go these days, I decided to create a QlikView document based on the original 151 Pokémon in the first generation (speaking about mixing good stuff).

27_01

Today’s post isn’t exactly a tutorial. I’ll just share the QVW I created and highlight some interesting features I think you can use to improve your own applications. Even if you’re not exactly the biggest PokĂŠmon fan, be sure to check it out. I’m sure you’ll find something that strikes your attention!  Continue reading “When QlikView meets PokĂŠmon”

QlikFreak Football

What happens when you mix QlikView with the best football leagues in the globe? In today’s post, I’ll share a little app I created to analyze data about my favorite soccer tournaments like the English Premier League, the German Bundesliga or the Serie A from Italy. So let’s take a break of business oriented dashboards and spend some time reviewing the wins, losses and goals of the last few years.

If you’re a football fan, you’ll stay for the discoveries. If you’re a QlikView enthusiast, you’ll stay for the tips regarding scripting and visualization. If you’re not neither of those, you’ll visit our Random page in order to see funny videos like a pug playing ‘Enter Sandman’ from Metallica in the drums.

As usual, you can download all the related files here. Ready? Let’s get started!

23_01

The first challenge in this endeavor was to find a good data source. However, a static XLS file wouldn’t do the trick. Since we’re in the middle of the season and there are matches every week, we need a way to update our file constantly. Even though it’s not the most common way to extract tables, don’t forget that QlikView can retrieve records from external websites (Data from Files > Web Files).

23_02

After browsing for a while, I found a great sports portal called SkySports where we could get all the information we needed. In order to load it to our model (and since I didn’t want to copy and paste the same code dozens of times), I relied on one of our oldest friends: the FOR… NEXT loop. The structure is not very complex, so I’ll let the code speak for itself: Continue reading “QlikFreak Football”

More things I hate about QlikView

Let me start this post with a question: What is wrong with you people? I was building a little app for analyzing which are your favorite topics in this blog when I came across a sad realization. Even though QlikFreak is full of useful tips about visualization and data modeling, it looks like the most popular post is… well… the one where I complain about everything 😛

22_01

In a way, writing this kind of posts is like talking about my problems with someone who really understands, and since I cannot afford a decent therapist, why don’t we put the constructive spirit aside and discuss the details we hate about the platform we love? Here we go: More things I hate about QlikView!

The extra space in listboxes when you use the AJAX client: I don’t know about you, but I’ve always had mixed feelings about the AJAX client. On one hand, it has great features such as notes, session collaboration and the fact that you don’t have to install anything special in order to use QlikView in desktops, laptops or even mobile devices. On the other hand, it slightly changes the size and alignment of the objects, modifies the amount of visible rows in straight / pivot tables and sometimes adds scrollbars to the charts. And well… I really hate unaligned objects in my apps!!! However, the thing that annoys me the most is, without a doubt, that blank space that appears at the end of certain listboxes:22_02

For God’s sake! Why. Are. You. There?!?! Aaaaarrrrghhhhh!!!

22_04

Bulk Actions: At some point in our lives, we’ve all wished that QlikView had some sort of bulk actions (you know, a magical “Apply to all” button). For example, let’s say you just finished creating a 10-column straight table and you want to center all the labels.  You go to the Presentation tab and try to select all the expressions but you can’t, so you end up either clicking each column and centering its title or changing the object type to a Pivot Table and doing it all at once (I’m not really sure why this only works for Pivot Tables). Continue reading “More things I hate about QlikView”