Audio

Mastering Qlik Sense

In ancient times, there were not a lot of options to learn QlikView. The easiest one was to enroll in one of QlikTech’s official courses. However, they were not as frequent (nor as cheap) as you’d like. Most of the Qlik-dinosaurs… I mean, the most experienced consultants I know, learned this way. The less fortunate (i.e. trainees like me), were forced to follow the exciting and not-at-all depressing path of reading the documentation files. Yeah, those massive PDFs that got installed alongside QlikView with 2,750 pages full of fun! Sounds useful, doesn’t it?

TRUMP

Luckily, those days are far over. Today, you can choose from a wide variety of learning options. The official Qlik courses are still there, but now they are taught much more often and in different languages and cities all around the globe. Some partners (like us), have even developed our own content to give customers a better experience with more examples and real-world problems.

Do you hate large groups of people? No problem, you can enroll to Shilpan’s course in Udemy or spend some time navigating in the Qlik Continuous Classroom from your office or home. Are you already an expert? Well, extend your skills with advanced courses like the Masters Summit, Qlik Sense Deep Dive or Websy / Vizlib’s workshops. Even the official (and super boring) documentation has evolved into a friendly portal that you can access anytime! Continue reading “Mastering Qlik Sense”

Qlik-Trivia

Hello everyone and welcome to QlikFreak. Since this is our last entry of the year and many of you are enjoying your holidays away from the office, I thought it would be cool to try something a little different. Today, instead of having a tutorial or a fun Qlik app, I created a Qlik trivia with interesting scripting scenarios that will make you think twice before writing down your answers!

I know you don’t want me to spoil all the surprises, so we’ll check the answers at the end of the post. So anyways, without further ado, let the games begin! OK, no, wait, before you go, there’s one more thing… I think you’ll get the same results regardless of the version you’re using, but just in case, I’m working with QlikView 12 SR4 and Qlik Sense 3.1 SR4 😛

30_00

Question 1:

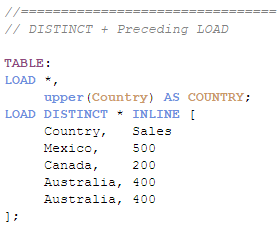
If you’re an experienced Qlik Developer, chances are that you’ve used DISTINCT in more than one of your scripts, right? Well then, tell me how many records will this table have:

30_01

a) 4 records          b) 3 records          c) 0 records          d) OMG, he’s using Qlik Sense

Tip: The last two records are exactly the same. Continue reading “Qlik-Trivia”

Threshold Bar Chart + Christmas Card

One of the biggest problems about being a QlikView Developer is that every time you see an interesting visualization, you immediately start wondering how you can use it in your own dashboards. For instance, a couple of days ago, I was wandering around in Twitter when I saw a message which, apparently, had something to do with the quality of the air in Berlin (sorry, but my German is not very good).

TBC_Twitter

As you can see, the structure of this chart is not overly complex: classic bar chart using a time dimension and a standard expression. However, a simple visual cue composed by a reference line and a different color makes it easier to identify where (of in this case, when) an element surpasses the threshold. In my opinion, it is an elegant and useful way to present data.

Since I didn’t have access to this particular data set, I decided to work with a sales QVD from one of the projects I’m currently working on and, after spending a few minutes in QlikView, this was the result:

TBC_1

I don’t know if this kind of representation has an official name, but I called it “Threshold Bar Chart” <<Patent pending>>. I know… I’m awful at naming things so, if you have a better title, be sure to share it in the comments section! As usual, you can download the QVW with the final chart here. The recipe is simple:

Continue reading “Threshold Bar Chart + Christmas Card”