Tag: map

Geo… what?

One of the most significant changes Qlik has experienced so far is the substantial growth of their product family. What once was a one-man show, is now a robust portfolio that addresses several business needs. Do you want pixel-perfect reports? Here’s NPrinting. You don’t like in-house deployments? Meet Qlik Sense Cloud. Do you need more data? Welcome to Qlik DataMarket. All these new modules help us work more efficiently, enrich our analyses, and ultimately, make better decisions.

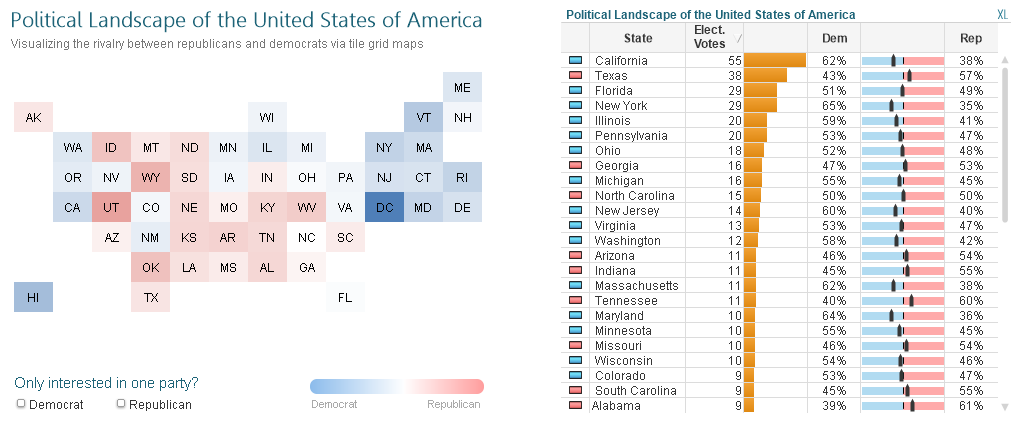
One of the most interesting newcomers in this list is Qlik GeoAnalytics (formerly known as Idevio). Even though it isn’t exactly new, I think there are still some misconceptions around this product. Yes, it is a tool that allows you to create cool maps in Qlik, but there’s much more to it. In this post, I’ll show you some of my favorite features and how they can help you analyze geographic data. This might not be a comprehensive list, but hopefully it will give you an idea of the real potential behind GeoAnalytics.

34_01 Continue reading “Geo… what?”

Tile Grid Maps

Have you ever had one of those “of course I can do that in QlikView” moments? As a Qlik developer it’s not uncommon to find yourself struggling to create a chart or pull off a complex script that nobody asked for, but for some strange reason, you decided to tas a personal challenge. Well, I just had one of those moments.

25_28

I couple of days ago I was wandering around my usual blogs when I found a post by Alberto Cairo  where he talked about an interactive visualization created by the FiveThirtyEight team regarding the political preferences in the United States. [By the way, if you don’t follow those blogs you are missing a lot of great stuff!]

25_29

Besides being a stunning way to present What-If scenarios, I liked the usage of the Tile Grid Maps, which have become a pretty popular visualization lately. What is a Tile Grid Map, you ask? Well, think of it as a mix between a choropleth map and a table heat map. If you want to see more examples, you can visit Bloomberg, The Washington Post or The New York Times.25_30

It is true that most of the times we strive for more accurate charts but ironically, this technique’s boon is that it disregards the actual size of the regions and translates them to equal-sized shapes (in this case, squares) so it becomes easier to see even the smallest areas. Therefore, this solution is excellent when the geographic size is not the most important thing, but maintaining a loose spatial distribution is.

So anyways… In today’s tutorial we’ll build something like this:

25_27 Continue reading “Tile Grid Maps”

Heat Map

Last week I found an interesting post about the fatal crashes in the US. It used a fascinating way of representing data and I thought it would be a good chart to complement some of my applications. The idea was simple: create a heat map based on a classic calendar.

16

Tutorial

First of all, you can find a QVW file with this chart here. You can save it in your QlikView Resource Library so you can easily paste it whenever you need it. I used a simple sales application to create this example. The steps are:

1.- Create a pivot table with 2 time dimensions. I found two options that work really well with this analysis, “Week and WeekDay” or “Month and Day”.

HM11

Continue reading “Heat Map”