One of the most significant changes Qlik has experienced so far is the substantial growth of their product family. What once was a one-man show, is now a robust portfolio that addresses several business needs. Do you want pixel-perfect reports? Here’s NPrinting. You don’t like in-house deployments? Meet Qlik Sense Cloud. Do you need more data? Welcome to Qlik DataMarket. All these new modules help us work more efficiently, enrich our analyses, and ultimately, make better decisions.
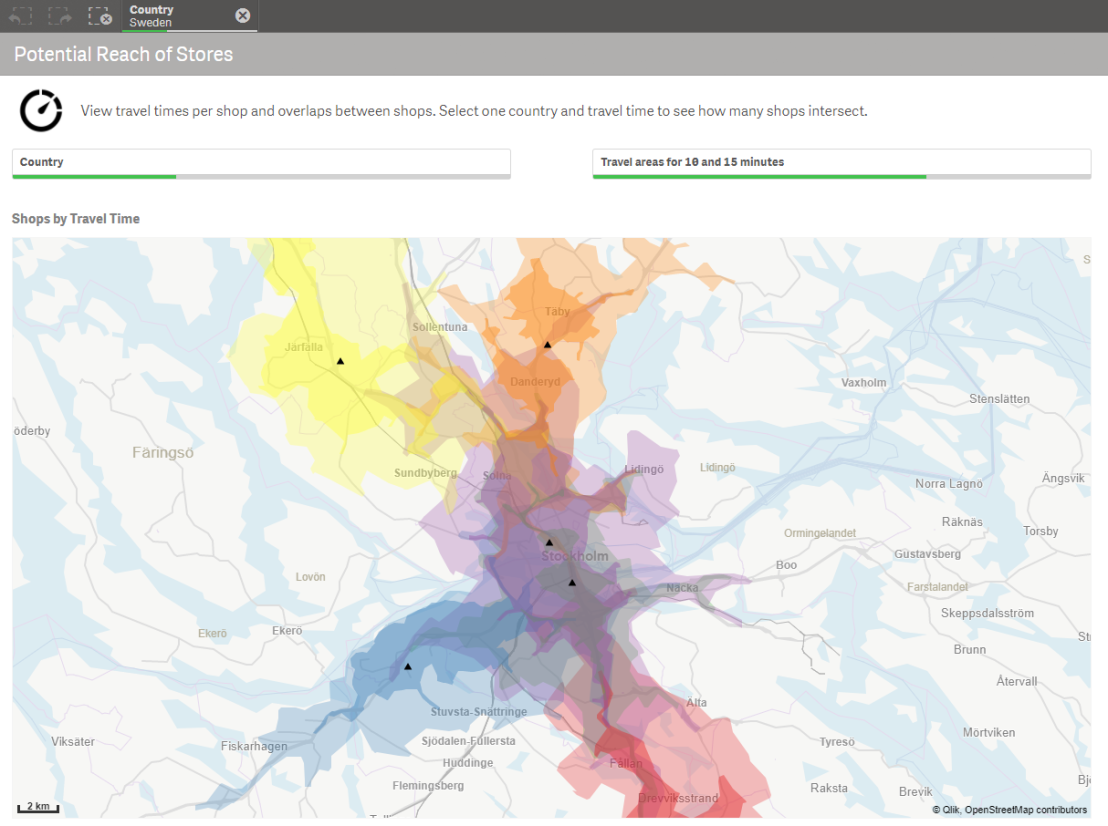
One of the most interesting newcomers in this list is Qlik GeoAnalytics (formerly known as Idevio). Even though it isn’t exactly new, I think there are still some misconceptions around this product. Yes, it is a tool that allows you to create cool maps in Qlik, but there’s much more to it. In this post, I’ll show you some of my favorite features and how they can help you analyze geographic data. This might not be a comprehensive list, but hopefully it will give you an idea of the real potential behind GeoAnalytics.

