Tag: football

When Qlik Sense meets FIFA World Cup

Hello everyone and welcome to QlikFreak! In the last few weeks, we’ve seen a lot of interesting things happening in the Qlik ecosystem. Personally, I’ve been playing a lot with the latest Qlik Sense release (yeah, the one with “the beast”) and I must admit it’s really cool. I specially liked the fact that you can change the grid size whenever you like and the new “Publish” option in the hub (sometimes, those small details make your life much better!). There are a couple of new courses available in the QCC, the data literacy initiatives are getting better and Qlik acquired Podium Data, which certainly will bring a new perspective to the company.

In addition to these events, I’m sure you’ve been extremely busy with other critical issues like scheduling fake meetings so you can watch the world cup in the meeting room with the huge screen. (Yes, I know you had a PowerPoint presentation in your screen, but you were watching all the games in your tablet, Maurice. You should be ashamed!)

Honestly, this was one of the best world cups I’ve seen (especially if you compare it to the last one!). We had great games, some unexpected results, a couple of heartwarming moments and of course, dozens of high quality memes. Actually, now that the dust has settled a little bit and everyone is getting back to their standard routine, why don’t you take some time to relax and analyze what happened during the tournament with a Qlik app? Get ready, because today Qlik Sense will meet the FIFA World Cup Russia 2018!

37_01

Continue reading “When Qlik Sense meets FIFA World Cup”

About Slopegraphs and Bumps Charts

Hey everyone! Today’s post answers a request from one of our readers and features two not-so-common visualizations that you can use to make time comparisons: slopegraphs and bumps charts. Although these objects have a very simple nature, they’re also quite elegant and intuitive, so there’s a good chance that they will help you get some unexpected insights in your analyses.

We’ll also discuss one or two tips that can help you improve their readability and make them more meaningful by adding extra context to the data. As requested, the football dataset that we’ve been using lately will give life to our examples! 😉

Slopegraph

Slopegraphs are a great way to compare two points in time. However, instead of describing the ups and downs along the way like traditional line charts, they focus on how the journey started and how it ended. This visualization is the perfect candidate for “then and now” analyses (much like that TV show that presents celebrities and how they looked 30 years ago). * Note to self: stop making that kind of references, people will laugh at you. You should recommend Cole’s blog instead. *

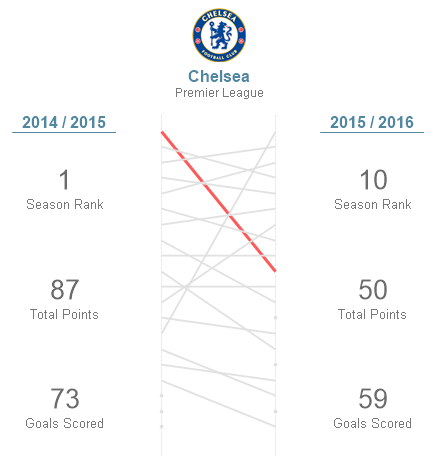
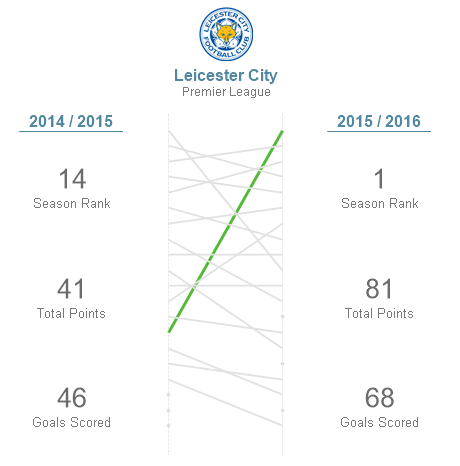
When working with these charts, our brain can easily spot patterns and recognize the distinctive slopes of certain elements in terms of direction or magnitude. It is also an intuitive way of showing how the rankings changed from a point in time to another, as the lines will intersect each other and end up in a different order.

26_01

In this example, we can visualize the performance of all the teams in the Premier League over the last two seasons. Each squad is portrayed by a line and its position and slope depend on the rank achieved in both the 2015 and 2016 tournaments. In order to improve the chart’s readability, you can highlight the selected team by adding some color and changing its line’s width.

26_02

* Fun Fact: This chart is so cool that it made it to the cover of one of my favorite books about data visualization, The Functional Art by Alberto Cairo. Continue reading “About Slopegraphs and Bumps Charts”