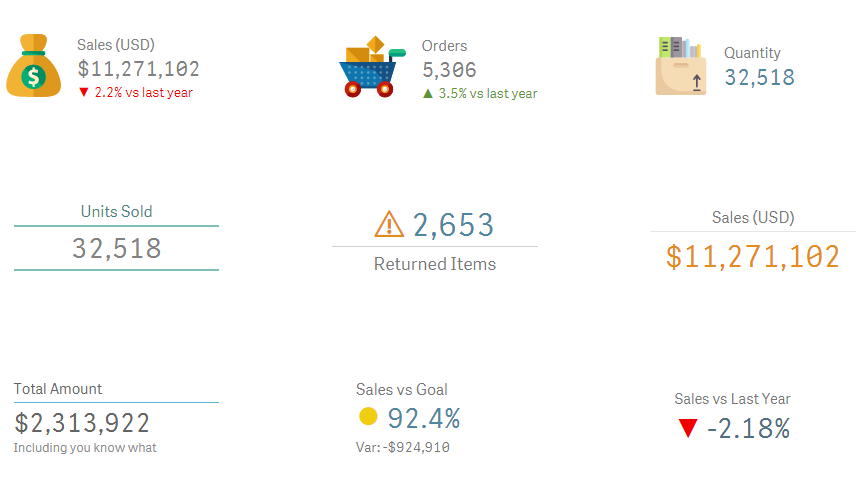
Qlik Sense is all about empowerment and extensibility. Whether you are a business user designing a new dashboard just by dragging and dropping objects in your browser or an experienced developer coding extensions, mashups and custom connectors, this platform always gives you the chance to challenge yourself and create something completely new.
In today’s post we’ll explore widgets, one of the easiest ways to build your own visualizations in Qlik Sense. In my opinion, this is a great first step if you’re a newbie or you’re transitioning from QlikView because, unlike JavaScript extensions, widgets are more accessible to people without programming experience and allow you to create useful things early in the learning process.
As usual, this post will include random tips and some finished goodies so you can dissect and modify them as needed! 😉 (Spoiler alert: Today we’ll be working with KPIs!)
About Widgets
Simply put, widgets are visualization objects that you can build using HTML and CSS. Once deployed, they can be created and configured just as any other chart in Qlik Sense.
While extensions are relatively simple to develop, they pose a big challenge for non-technical people like me because they involve some knowledge about JavaScript and other dark arts such as RequireJS and D3. These skills are not super-difficult to acquire, but they demand a fair amount of time and effort before you can create something decent.
If you want to know more about extensions, follow Karl Pover’s journey to become a Qlik Sense Developer and this amazing video colletion from Speros Kokenes.
In contrast, widgets rely on earthly technologies, namely HTML and CSS. Luckily for us, these two are much simpler to learn and have a lot of cool things to offer to our dashboards. Don’t worry, even if you have never heard of them, you’ll be able to create not-so-awful-and-almost-cool visualizations right after the first tutorial. Continue reading “Widgets 101”
